Hi All,
You can now generate full-res contour map images using the latest developmental build of L3DT Pro (v2.9 build 4, released 4th of Jan).
To generate the contour map image, select the '
Graphs->More graphs' menu option, and select the 'HF_CalcContours' option. When the calculation is complete, you will be asked to save the output image as a bitmap [note: don't hit cancel on the progress window before saving!]
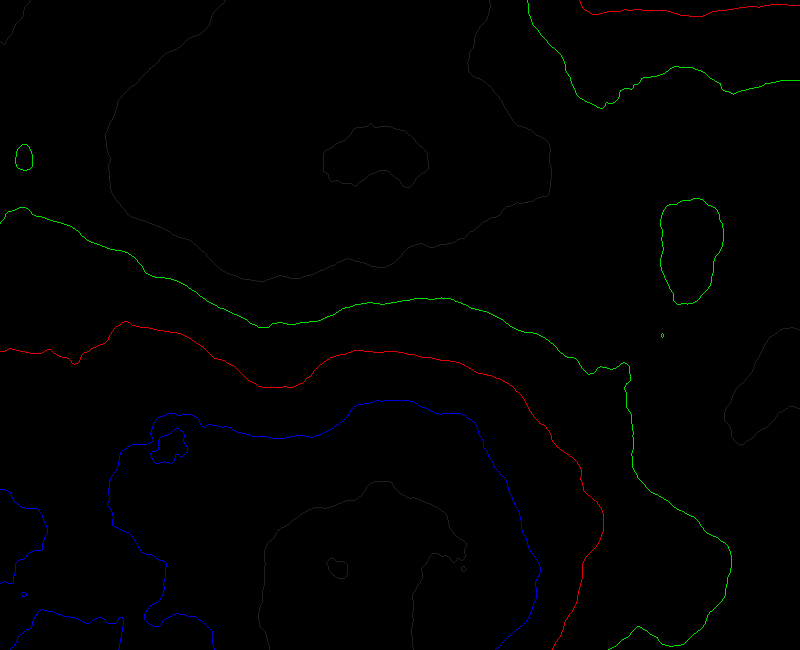
Please note that by default the graph produces an output image containing only the contour lines on a black background, such as that shown below:
If you want the heightfield elevation shading to be shown, first edit the graph using the 'graph' button on the toolbar, then double-click on the palette name filter, and set the value to "Monochrome" (case sensitive, no carriage return / newline, etc). If you want to change the colour of the background, you'll need to create a new palette PNG image in the 'Palettes' resource folder containing the desired colour, and set the name of the palette in the graph to match the PNG file name (sans extension).
Please also note that there is currently no way to change the colours or intervals of the contour lines. This will be added in a future update.
Please let me know if you find any problems.
Best regards,
Aaron.