| L3DT users' community |
|
| Large 3D terrain generator |
Export Contours
16 posts
• Page 1 of 2 • 1, 2
Export Contours
Aaron, is there anyway to export those nice contour lines L3dt produces?
That'd be great. I actually find your program useful in my day job (archaeologist). Building 3d worlds from DEM is much easier with your program than with the higher priced stuff (arcview). The new georeference plugin makes it even more so.
Would they be exportable as vector or raster? I see uses for both
Is this feature still in the pipeline? For the maps I'm working on, contour lines are very important and I still haven't found an easy way to generate them (it's even more frustrating to see them in l3dt but not being able to export them;)).
I'd be very grateful if you could implement an exporter. Keep up the great work! Cheers, Heiko 3rd Supplement
Plans, Places, Stuff, Stories
For contour lines I just take a screenshot, and then open in an image editor to trim off the stuff not needed.
thanks for the tip, but the pictures I need them for are 8k x 8k, so unfortunately screenshots can't really solve the problem. 3rd Supplement
Plans, Places, Stuff, Stories
Hmmm, works fine for what I use it for. What is the use of the contour-maps, them selves, is this just to show degrees of height, as you would see on a topographical map? Just curios, I still might be able to help until something better comes along, sometimes you have to hand edit maps, and I paint my height-maps by hand. I might be able to help, and I work for credit for Independent devs getting off the ground:O)
@lmaceleighton Thanks a lot for the offer, but with my workflow here I have to do it myself (+ I'm pretty sure you don't want to do this every second week for credit
@Telarus Sounds nice. If there even was a way to customize the interval l3dt would be perfect for me. 3rd Supplement
Plans, Places, Stuff, Stories
Hi All,
I apologise for the delay in implementing this feature. I'll try to include it in the next major release.
Sorry, I doubt that would would work as intended. You'll get gaps in the contour lines on steep terrain, and on flat terrain the contour lines may be more than one pixel wide. The contour line algorithm uses some nearest-neighbour tests that aren't supported by the climate algorithm. Best regards, Aaron.
Great! Thanks Aaron. In the meantime, PS and Illustrator do the trick for me, but, well, it's time consuming and far from perfect. Looking forward to the export feature. 3rd Supplement
Plans, Places, Stuff, Stories
Hi Guys,
Just a quick note: I've added a calculation to L3DT to generate the contour map at full resolution. However, I still have to implemented an interface to allow users to change the contour line intervals or colours. I'll let you know when it's all ready for testing. Cheers, Aaron.
Hi All,
You can now generate full-res contour map images using the latest developmental build of L3DT Pro (v2.9 build 4, released 4th of Jan). To generate the contour map image, select the 'Graphs->More graphs' menu option, and select the 'HF_CalcContours' option. When the calculation is complete, you will be asked to save the output image as a bitmap [note: don't hit cancel on the progress window before saving!] Please note that by default the graph produces an output image containing only the contour lines on a black background, such as that shown below: 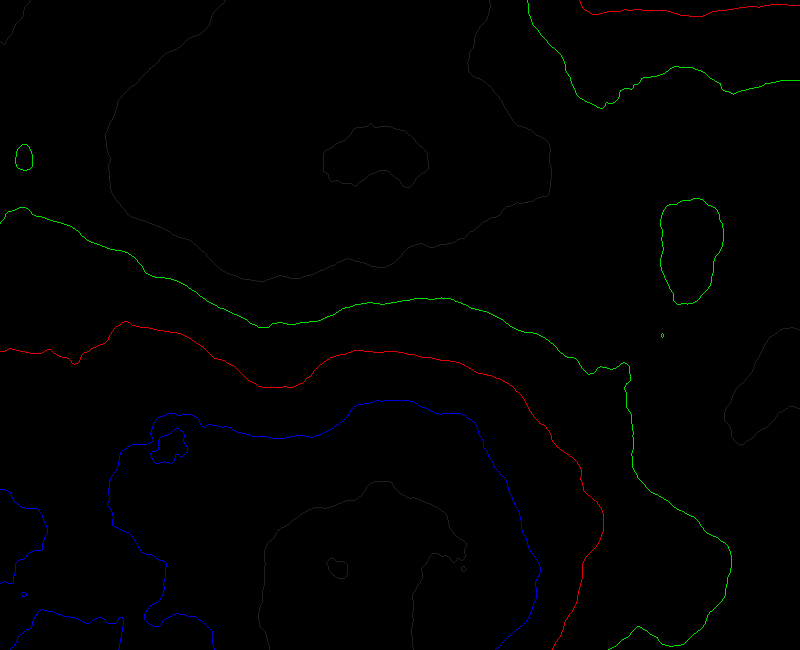
If you want the heightfield elevation shading to be shown, first edit the graph using the 'graph' button on the toolbar, then double-click on the palette name filter, and set the value to "Monochrome" (case sensitive, no carriage return / newline, etc). If you want to change the colour of the background, you'll need to create a new palette PNG image in the 'Palettes' resource folder containing the desired colour, and set the name of the palette in the graph to match the PNG file name (sans extension). Please also note that there is currently no way to change the colours or intervals of the contour lines. This will be added in a future update. Please let me know if you find any problems. Best regards, Aaron.
16 posts
• Page 1 of 2 • 1, 2
Who is onlineUsers browsing this forum: No registered users and 4 guests |