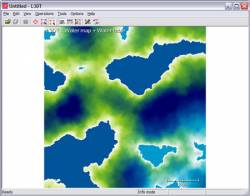
Water map schemesSeveral water map display options are available to aid the user in visualising water map data (e.g. salinity, water table). The following water map display options are available in the 'View→Display effects' menu:
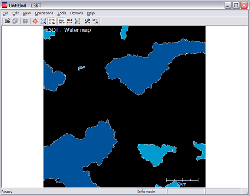
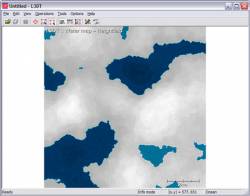
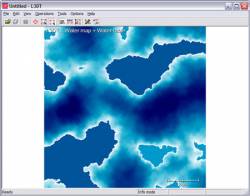
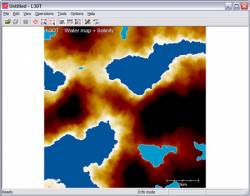
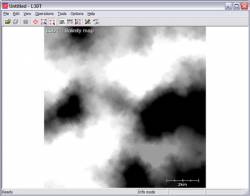
With all these options disabled you will see only the position of water bodies on a black background. Lakes are light blue, sea is darker blue, and coastlines are white. With heightfield blending you can see the water level and depth of water bodies, as well as the general land shape. This is particularly useful when flooding water bodies manually. Blending in the water table shows a ramped white→aqua→blue→black palette (in order of increasing depth below surface). The salinity map uses a ramped white→yellow→red→black palette (in order of decreasing salinity). If both the water table and the salinity map are displayed, the white→aqua→blue→black palette of the water table blends to a white→yellow→green→black palette at high salinity. Of course, you can view the salinity map on its own by selecting the 'View→Select map→Salinity map' option in the menu. In this mode, salinity is displayed as a simple grey-map. If the psychodelic colour schemes are too much for you, you can always double-click on the water map and L3DT will display the pixel information numerically in a dialog box. Except where otherwise noted, content on this wiki is licensed under the following license:CC Attribution-Share Alike 3.0 Unported
|

